> ## Documentation Index
> Fetch the complete documentation index at: https://tigerdata-747200db-chore-custom-colored-homepage.mintlify.site/llms.txt
> Use this file to discover all available pages before exploring further.
# Analytics on transport and geospatial data
> Simulate and analyze a transport dataset in your Tiger Cloud service
export const COMPANY = 'TigerData';
export const COLUMNSTORE = 'columnstore';
export const CONSOLE = 'Tiger Cloud Console';
export const TIMESCALE_DB = 'TimescaleDB';
export const SERVICE_SHORT = 'service';
export const SERVICE_LONG = 'Tiger Cloud service';
Real-time analytics refers to the process of collecting, analyzing, and interpreting data instantly as it
is generated. This approach enables you track and monitor activity, and make decisions based on real-time
insights on data stored in a {SERVICE_LONG}.
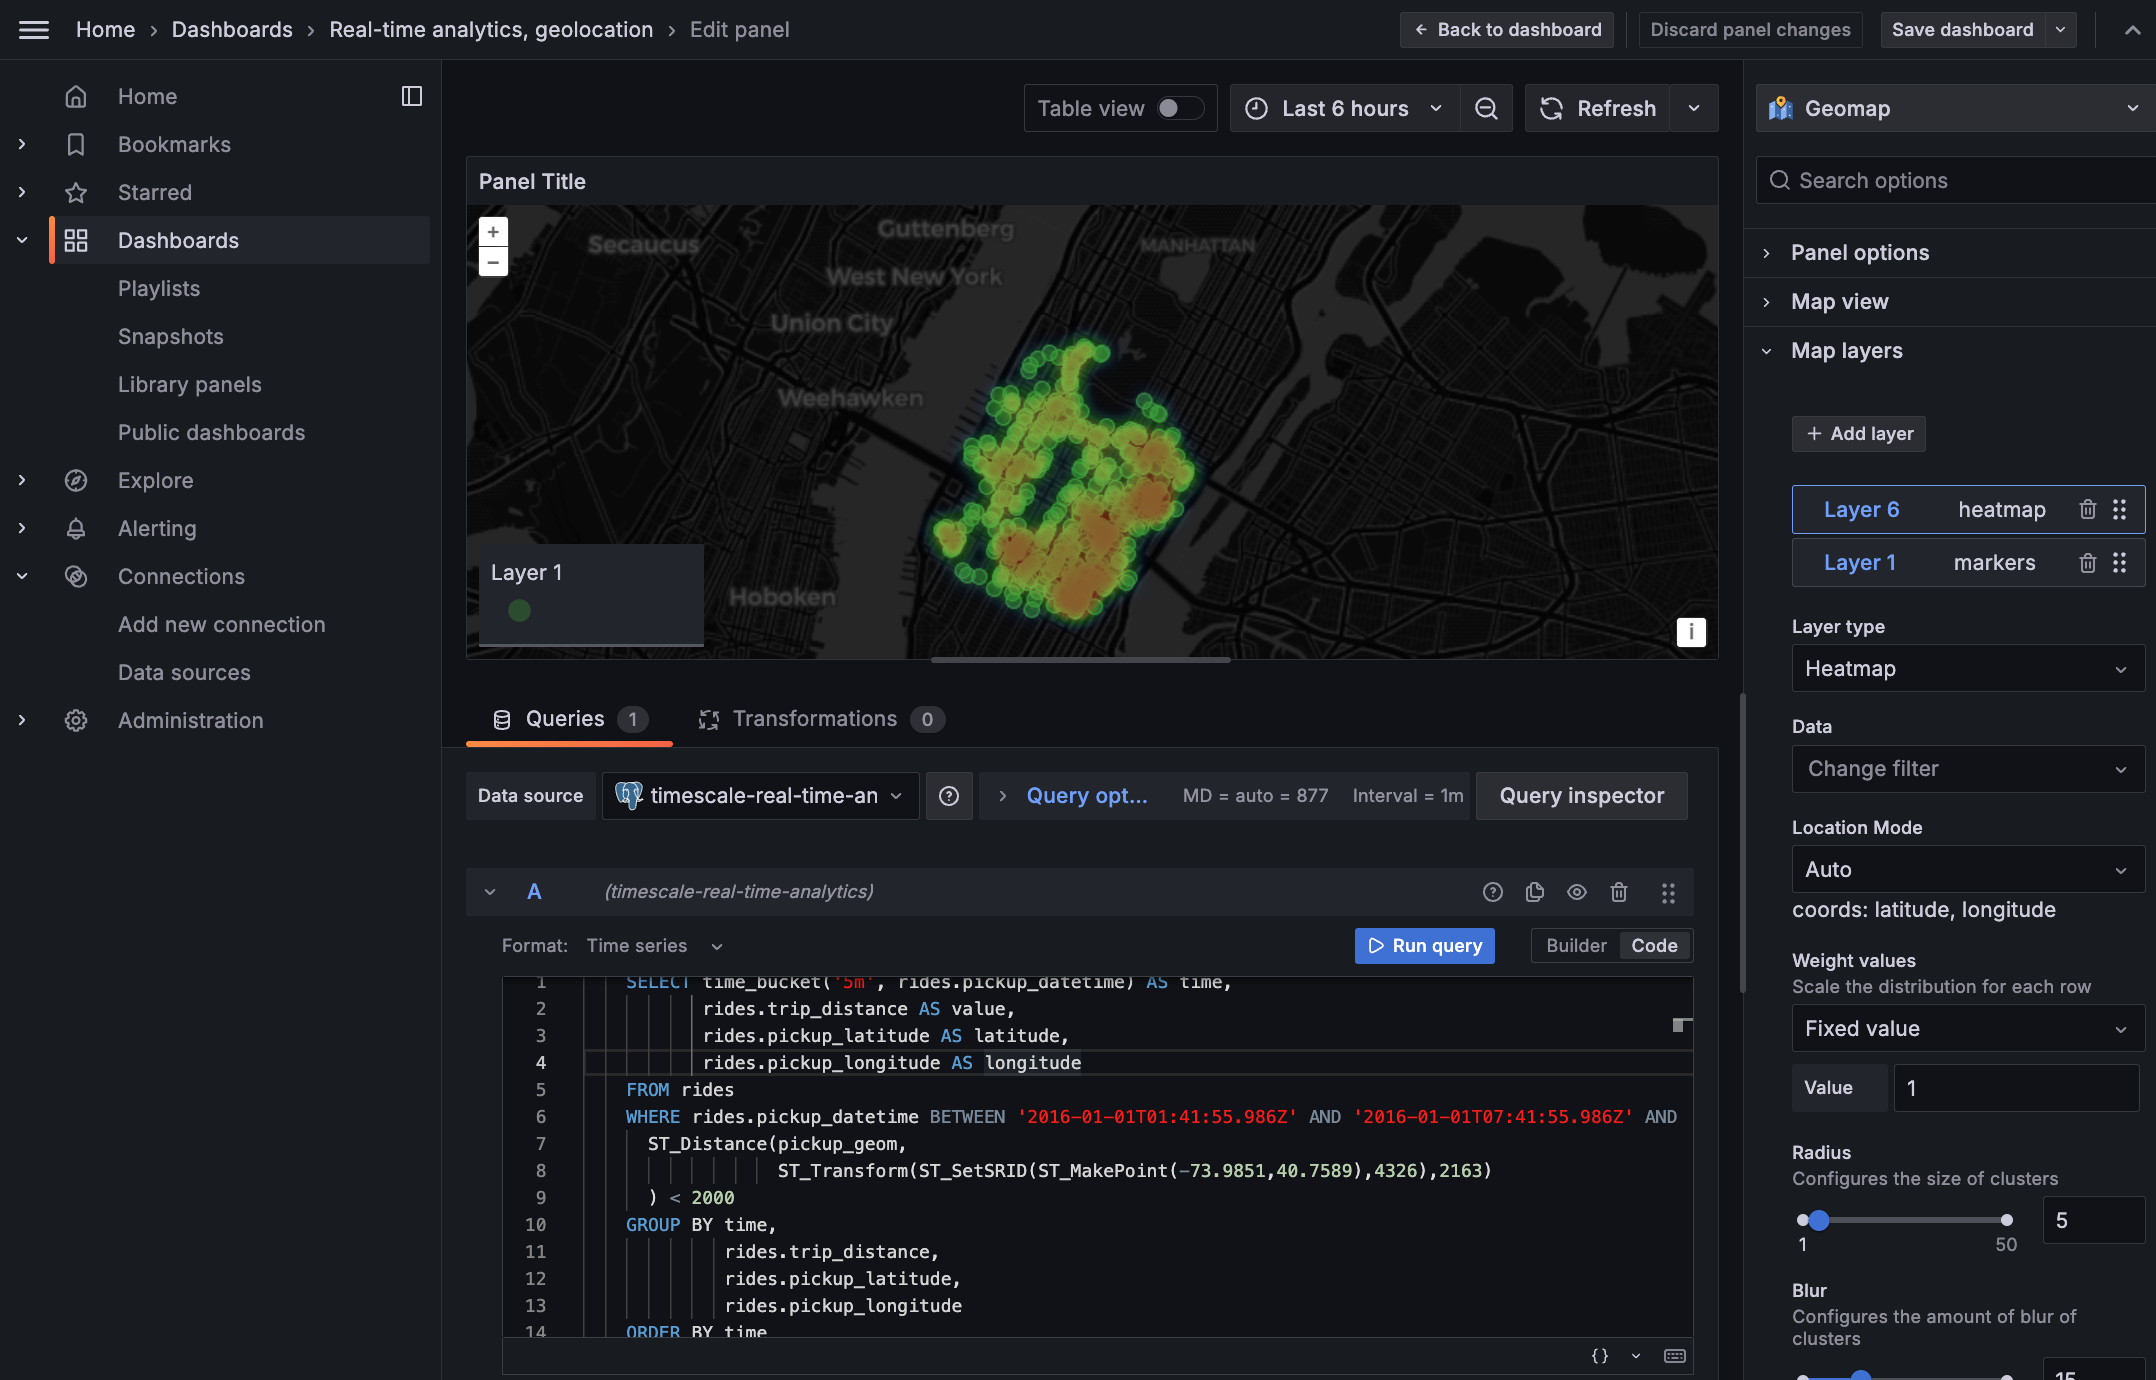
This page shows you how to integrate [Grafana][grafana-docs] with a {SERVICE_LONG} and make insights based on visualization
of data optimized for size and speed in the columnstore.
## Prerequisites
* Install and run [self-managed Grafana][grafana-self-managed], or sign up for [Grafana Cloud][grafana-cloud].
## Optimize time-series data in hypertables
## Optimize your data for real-time analytics
When {TIMESCALE_DB} converts a chunk to the columnstore, it automatically creates a different schema for your
data. {TIMESCALE_DB} creates and uses custom indexes to incorporate the `segmentby` and `orderby` parameters when
you write to and read from the columstore.
To increase the speed of your analytical queries by a factor of 10 and reduce storage costs by up to 90%, convert data
to the columnstore:
1. **Connect to your {SERVICE_LONG}**
In [{CONSOLE}][services-portal] open an [SQL editor][in-console-editors]. The in-Console editors display the query speed.
You can also connect to your {SERVICE_SHORT} using [psql][connect-using-psql].
2. **Add a policy to convert chunks to the columnstore at a specific time interval**
For example, convert data older than 8 days old to the columstore:
```sql
CALL add_columnstore_policy('rides', INTERVAL '8 days');
```
See [add\_columnstore\_policy][add_columnstore_policy].
The data you imported for this tutorial is from 2016, it was already added to the {COLUMNSTORE} by default. However,
you get the idea. To see the space savings in action, follow [Try the key {COMPANY} features][try-timescale-features].
Just to hit this one home, by converting cooling data to the columnstore, you have increased the speed of your analytical
queries by a factor of 10, and reduced storage by up to 90%.
## Monitor performance over time
A Grafana dashboard represents a view into the performance of a system, and each dashboard consists of one or
more panels, which represent information about a specific metric related to that system.
To visually monitor the volume of taxi rides over time:
1. **Create the dashboard**
1. On the `Dashboards` page, click `New` and select `New dashboard`.
2. Click `Add visualization`.
3. Select the data source that connects to your {SERVICE_LONG}.
The `Time series` visualization is chosen by default.
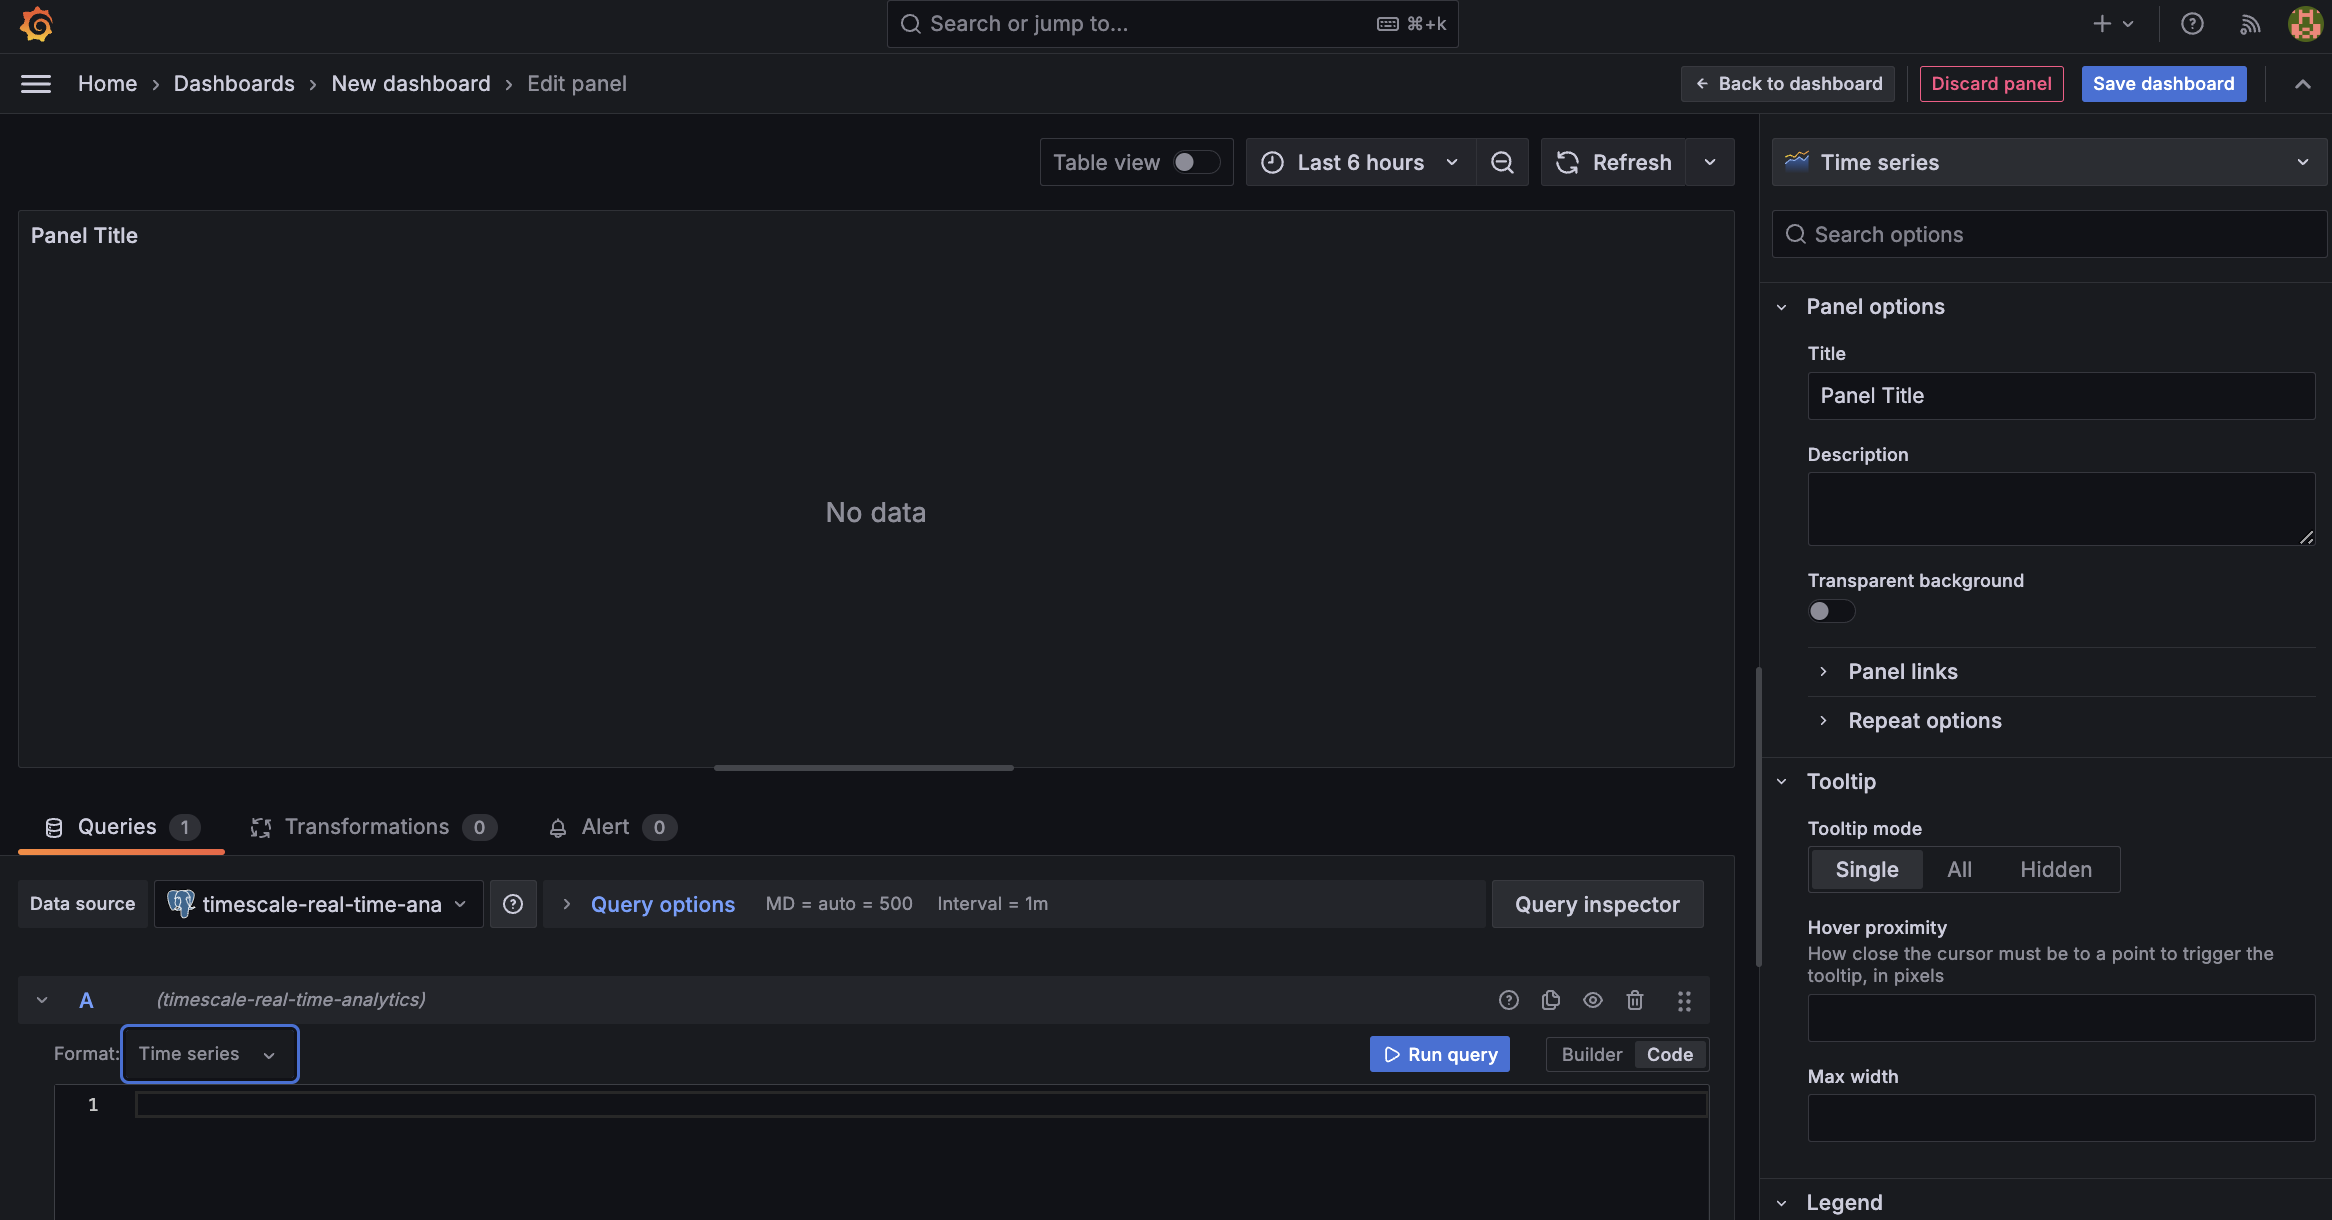
4. In the `Queries` section, select `Code`, then select `Time series` in `Format`.
5. Select the data range for your visualization:
the data set is from 2016. Click the date range above the panel and set:
* From: `2016-01-01 01:00:00`
* To: `2016-01-30 01:00:00`
2. **Combine \$TIMESCALE\_DB and Grafana functionality to analyze your data**
Combine a {TIMESCALE_DB} [time\_bucket][use-time-buckets], with the Grafana `$__timefilter()` function to set the
`pickup_datetime` column as the filtering range for your visualizations.
```sql
SELECT
time_bucket('1 day', pickup_datetime) AS "time",
COUNT(*)
FROM rides
WHERE $__timeFilter(pickup_datetime)
GROUP BY time
ORDER BY time;
```
This query groups the results by day and orders them by time.
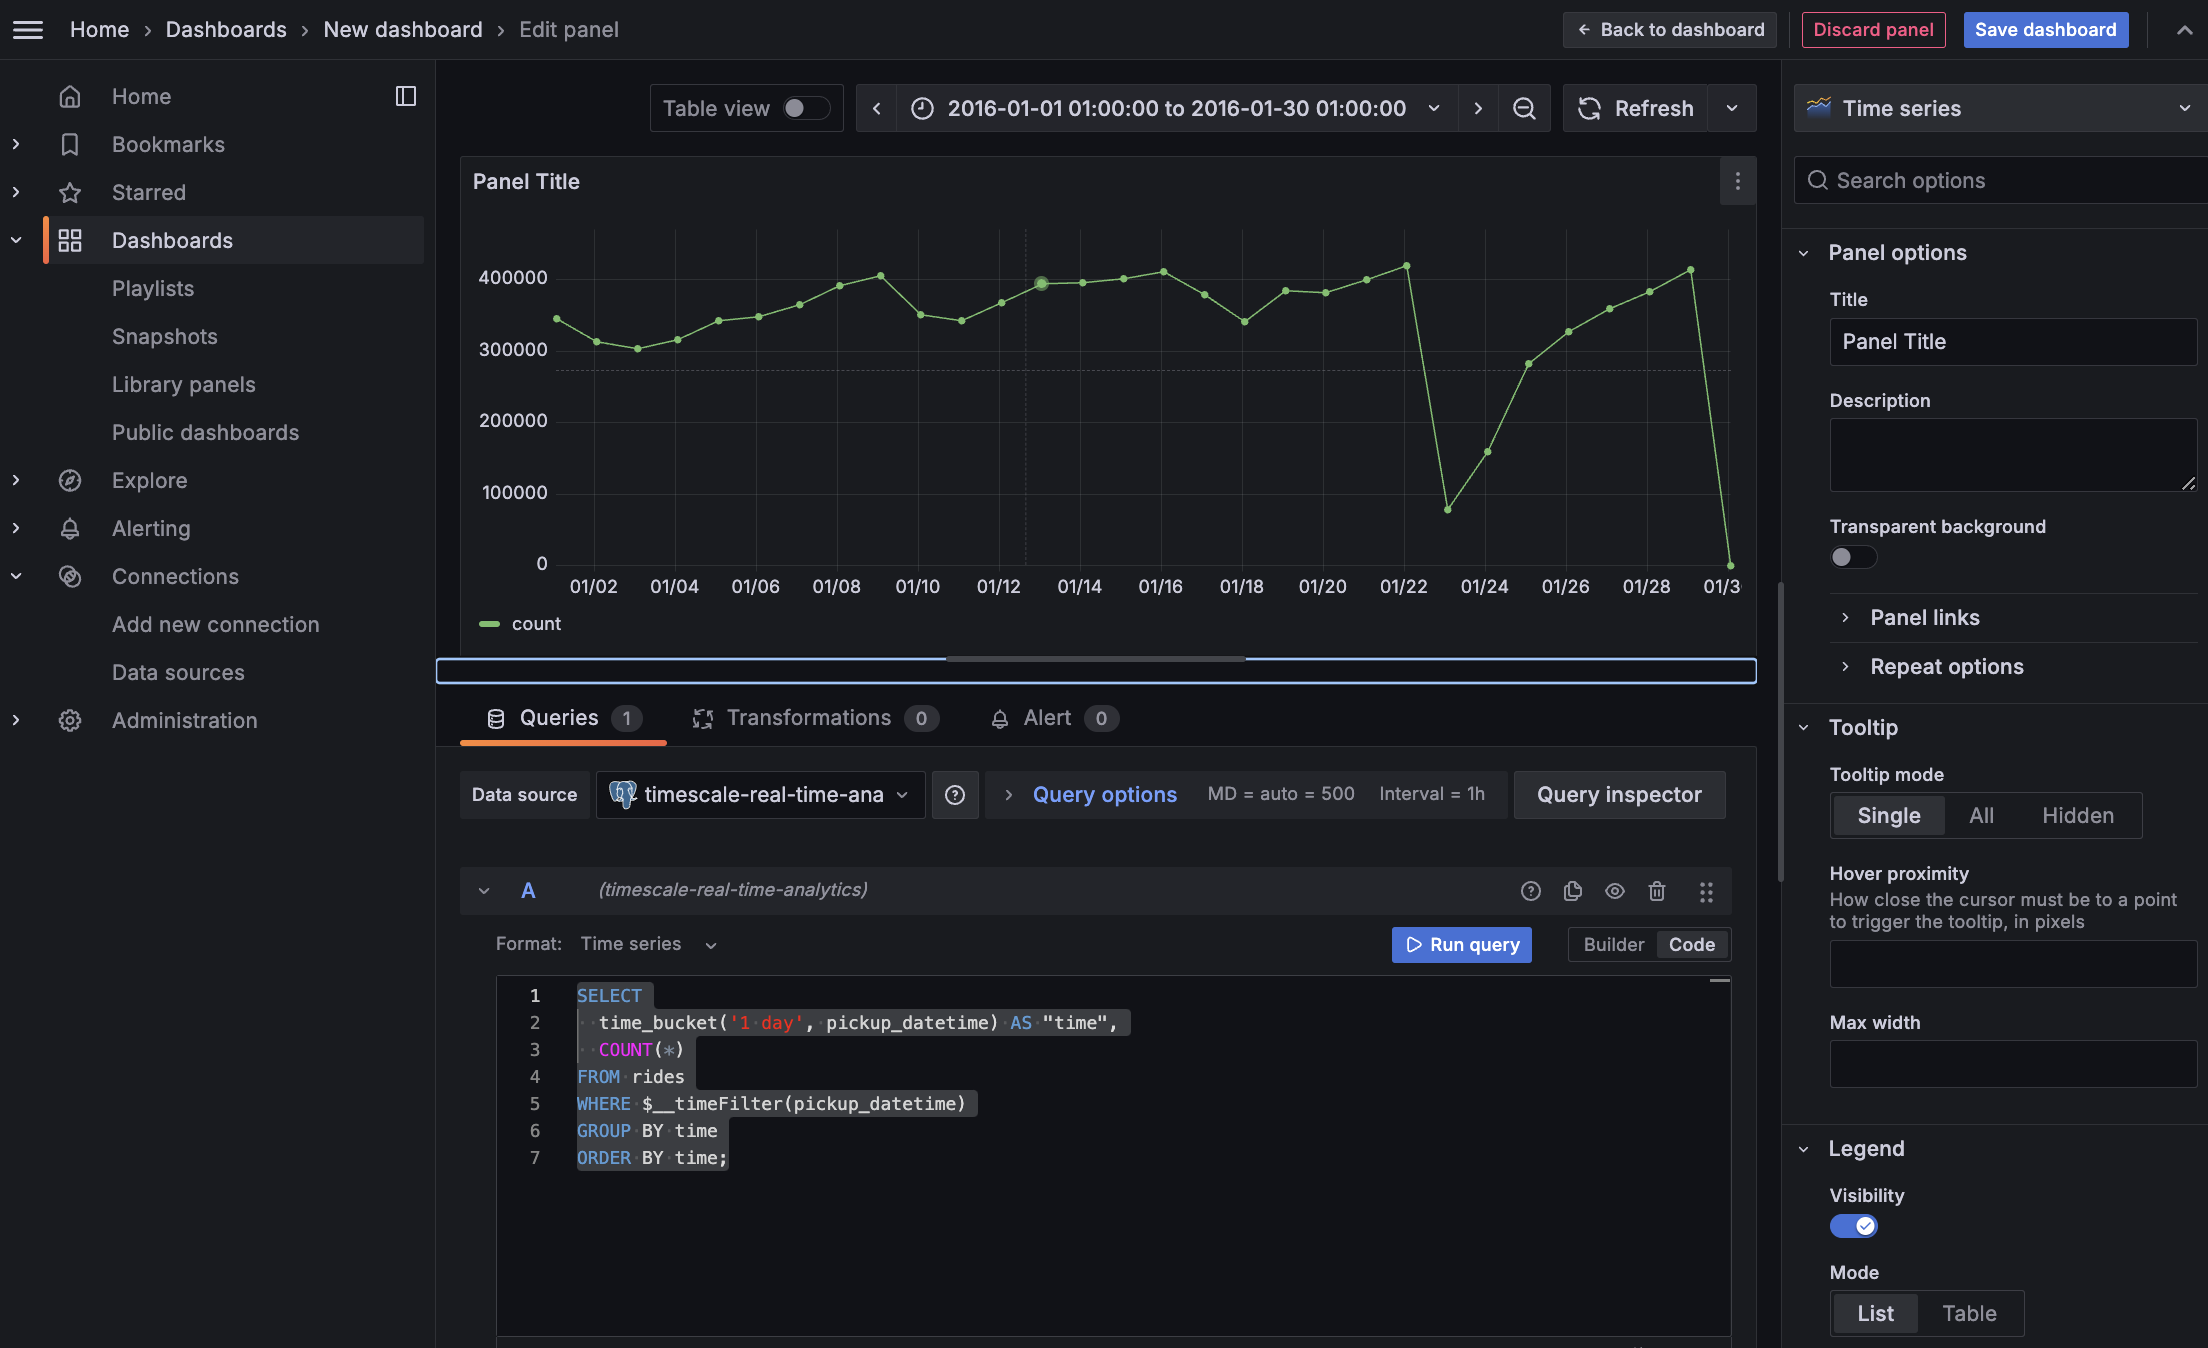
3. **Click `Save dashboard`**
## Optimize revenue potential
Having all this data is great but how do you use it? Monitoring data is useful to check what
has happened, but how can you analyse this information to your advantage? This section explains
how to create a visualization that shows how you can maximize potential revenue.
You have integrated Grafana with a {SERVICE_LONG} and made insights based on visualization of
your data.
[grafana-docs]: https://grafana.com/docs/
[grafana-self-managed]: https://grafana.com/get/?tab=self-managed
[grafana-cloud]: https://grafana.com/get/
[use-time-buckets]: /use-timescale/:currentVersion:/time-buckets/use-time-buckets/
[job]: /api/:currentVersion:/actions/add_job/
[alter_table_hypercore]: /api/:currentVersion:/hypercore/alter_table/
[compression_continuous-aggregate]: /api/:currentVersion:/hypercore/alter_materialized_view/
[informational-views]: /api/:currentVersion:/informational-views/jobs/
[add_columnstore_policy]: /api/:currentVersion:/hypercore/add_columnstore_policy/
[hypercore_workflow]: /api/:currentVersion:/hypercore/#hypercore-workflow
[alter_job]: /api/:currentVersion:/actions/alter_job/
[remove_columnstore_policy]: /api/:currentVersion:/hypercore/remove_columnstore_policy/
[in-console-editors]: /getting-started/:currentVersion:/run-queries-from-console/
[services-portal]: https://console.cloud.timescale.com/dashboard/services
[connect-using-psql]: /integrations/:currentVersion:/psql#connect-to-your-service
[insert]: /use-timescale/:currentVersion:/write-data/insert/
[hypercore]: /use-timescale/:currentVersion:/hypercore/
[try-timescale-features]: /getting-started/:currentVersion:/try-key-features-timescale-products/