> ## Documentation Index
> Fetch the complete documentation index at: https://tigerdata-747200db-chore-custom-colored-homepage.mintlify.site/llms.txt
> Use this file to discover all available pages before exploring further.
# Real-time analytics with Tiger Cloud and Grafana
> Integrate Grafana with a Tiger Cloud service and make insights based on visualization of data optimized for size and speed in the columnstore
export const CONSOLE = 'Tiger Cloud Console';
export const TIMESCALE_DB = 'TimescaleDB';
export const SERVICE_SHORT = 'service';
export const SERVICE_LONG = 'Tiger Cloud service';
Energy providers understand that customers tend to lose patience when there is not enough power for them
to complete day-to-day activities. Task one is keeping the lights on. If you are transitioning to renewable energy,
it helps to know when you need to produce energy so you can choose a suitable energy source.
Real-time analytics refers to the process of collecting, analyzing, and interpreting data instantly as it is generated.
This approach enables you to track and monitor activity, make the decisions based on real-time insights on data stored in
a {SERVICE_LONG} and keep those lights on.
[Grafana][grafana-docs] is a popular data visualization tool that enables you to create customizable dashboards
and effectively monitor your systems and applications.
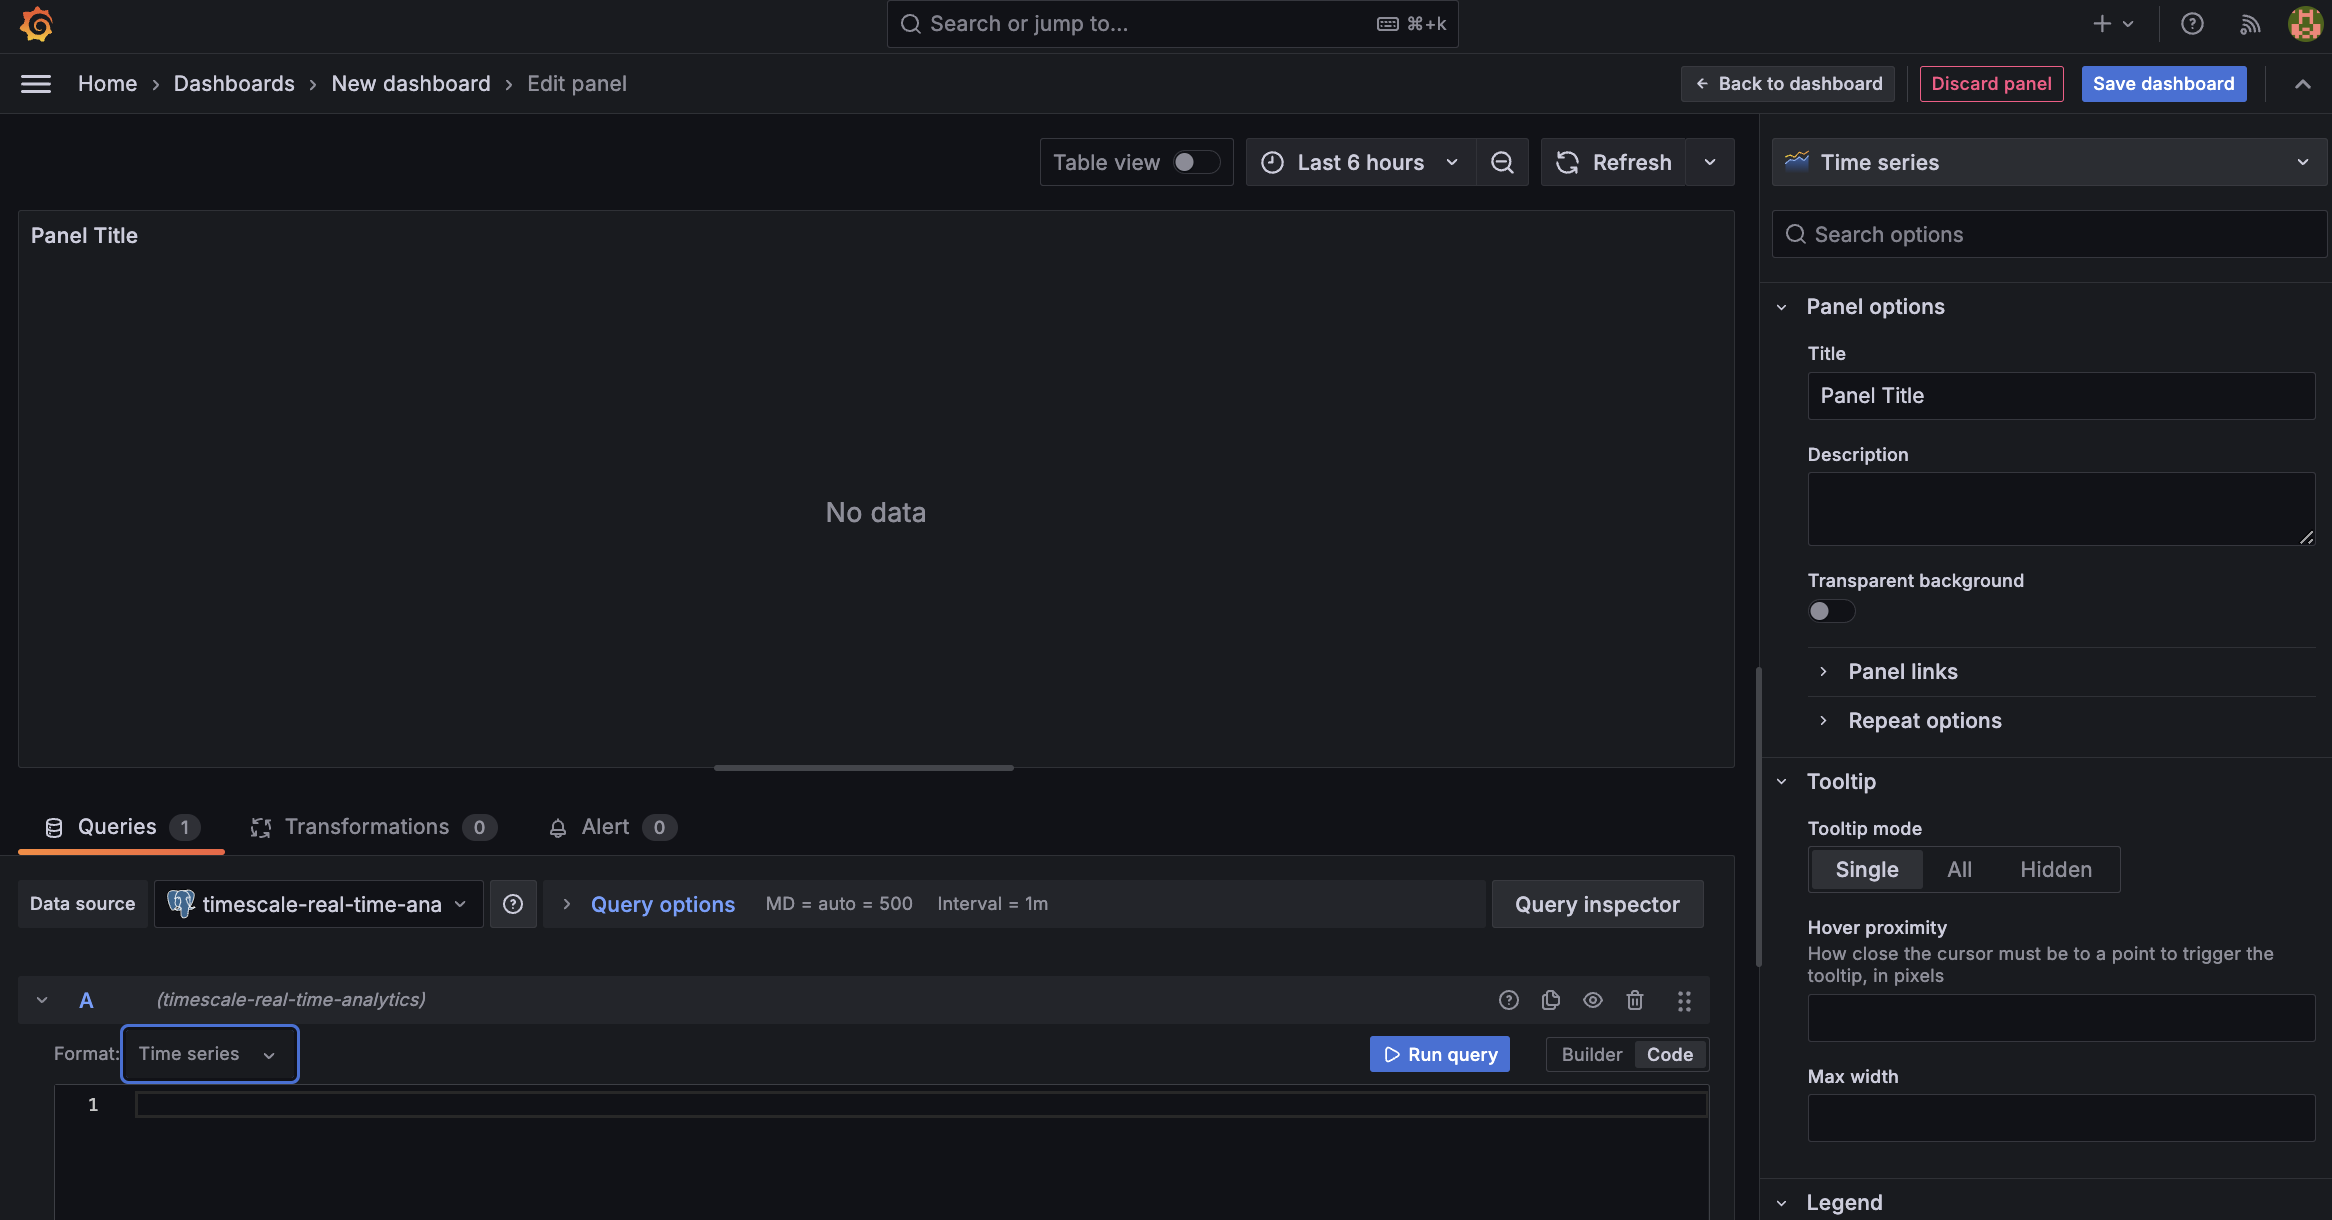
This page shows you how to integrate Grafana with a {SERVICE_LONG} and make insights based on visualization of
data optimized for size and speed in the columnstore.
## Prerequisites
* Install and run [self-managed Grafana][grafana-self-managed], or sign up for [Grafana Cloud][grafana-cloud].
## Optimize time-series data in hypertables
## Optimize your data for real-time analytics
When {TIMESCALE_DB} converts a chunk to the columnstore, it automatically creates a different schema for your
data. {TIMESCALE_DB} creates and uses custom indexes to incorporate the `segmentby` and `orderby` parameters when
you write to and read from the columstore.
To increase the speed of your analytical queries by a factor of 10 and reduce storage costs by up to 90%, convert data
to the columnstore:
1. **Connect to your {SERVICE_LONG}**
In [{CONSOLE}][services-portal] open an [SQL editor][in-console-editors]. The in-Console editors display the query speed.
You can also connect to your {SERVICE_SHORT} using [psql][connect-using-psql].
2. **Add a policy to convert chunks to the columnstore at a specific time interval**
For example, 60 days after the data was added to the table:
```sql
CALL add_columnstore_policy('metrics', INTERVAL '8 days');
```
See [add\_columnstore\_policy][add_columnstore_policy].
3. **Faster analytical queries on data in the columnstore**
Now run the analytical query again:
```sql
SELECT time_bucket('1 day', created, 'Europe/Berlin') AS "time",
round((last(value, created) - first(value, created)) * 100.) / 100. AS value
FROM metrics
WHERE type_id = 5
GROUP BY 1;
```
On this amount of data, this analytical query on data in the columnstore takes about 250ms.
Just to hit this one home, by converting cooling data to the columnstore, you have increased the speed of your analytical
queries by a factor of 10, and reduced storage by up to 90%.
## Write fast analytical queries
Aggregation is a way of combining data to get insights from it. Average, sum, and count are all examples of simple
aggregates. However, with large amounts of data aggregation slows things down, quickly. Continuous aggregates
are a kind of hypertable that is refreshed automatically in the background as new data is added, or old data is
modified. Changes to your dataset are tracked, and the hypertable behind the continuous aggregate is automatically
updated in the background.
By default, querying continuous aggregates provides you with real-time data. Pre-aggregated data from the materialized
view is combined with recent data that hasn't been aggregated yet. This gives you up-to-date results on every query.
You create continuous aggregates on uncompressed data in high-performance storage. They continue to work
on [data in the columnstore][test-drive-enable-compression]
and [rarely accessed data in tiered storage][test-drive-tiered-storage]. You can even
create [continuous aggregates on top of your continuous aggregates][hierarchical-caggs].
## Visualize energy consumption
A Grafana dashboard represents a view into the performance of a system, and each dashboard consists of one or
more panels, which represent information about a specific metric related to that system.
To visually monitor the volume of energy consumption over time:
1. **Create the dashboard**
1. On the `Dashboards` page, click `New` and select `New dashboard`.
2. Click `Add visualization`, then select the data source that connects to your {SERVICE_LONG} and the `Bar chart`
visualization.
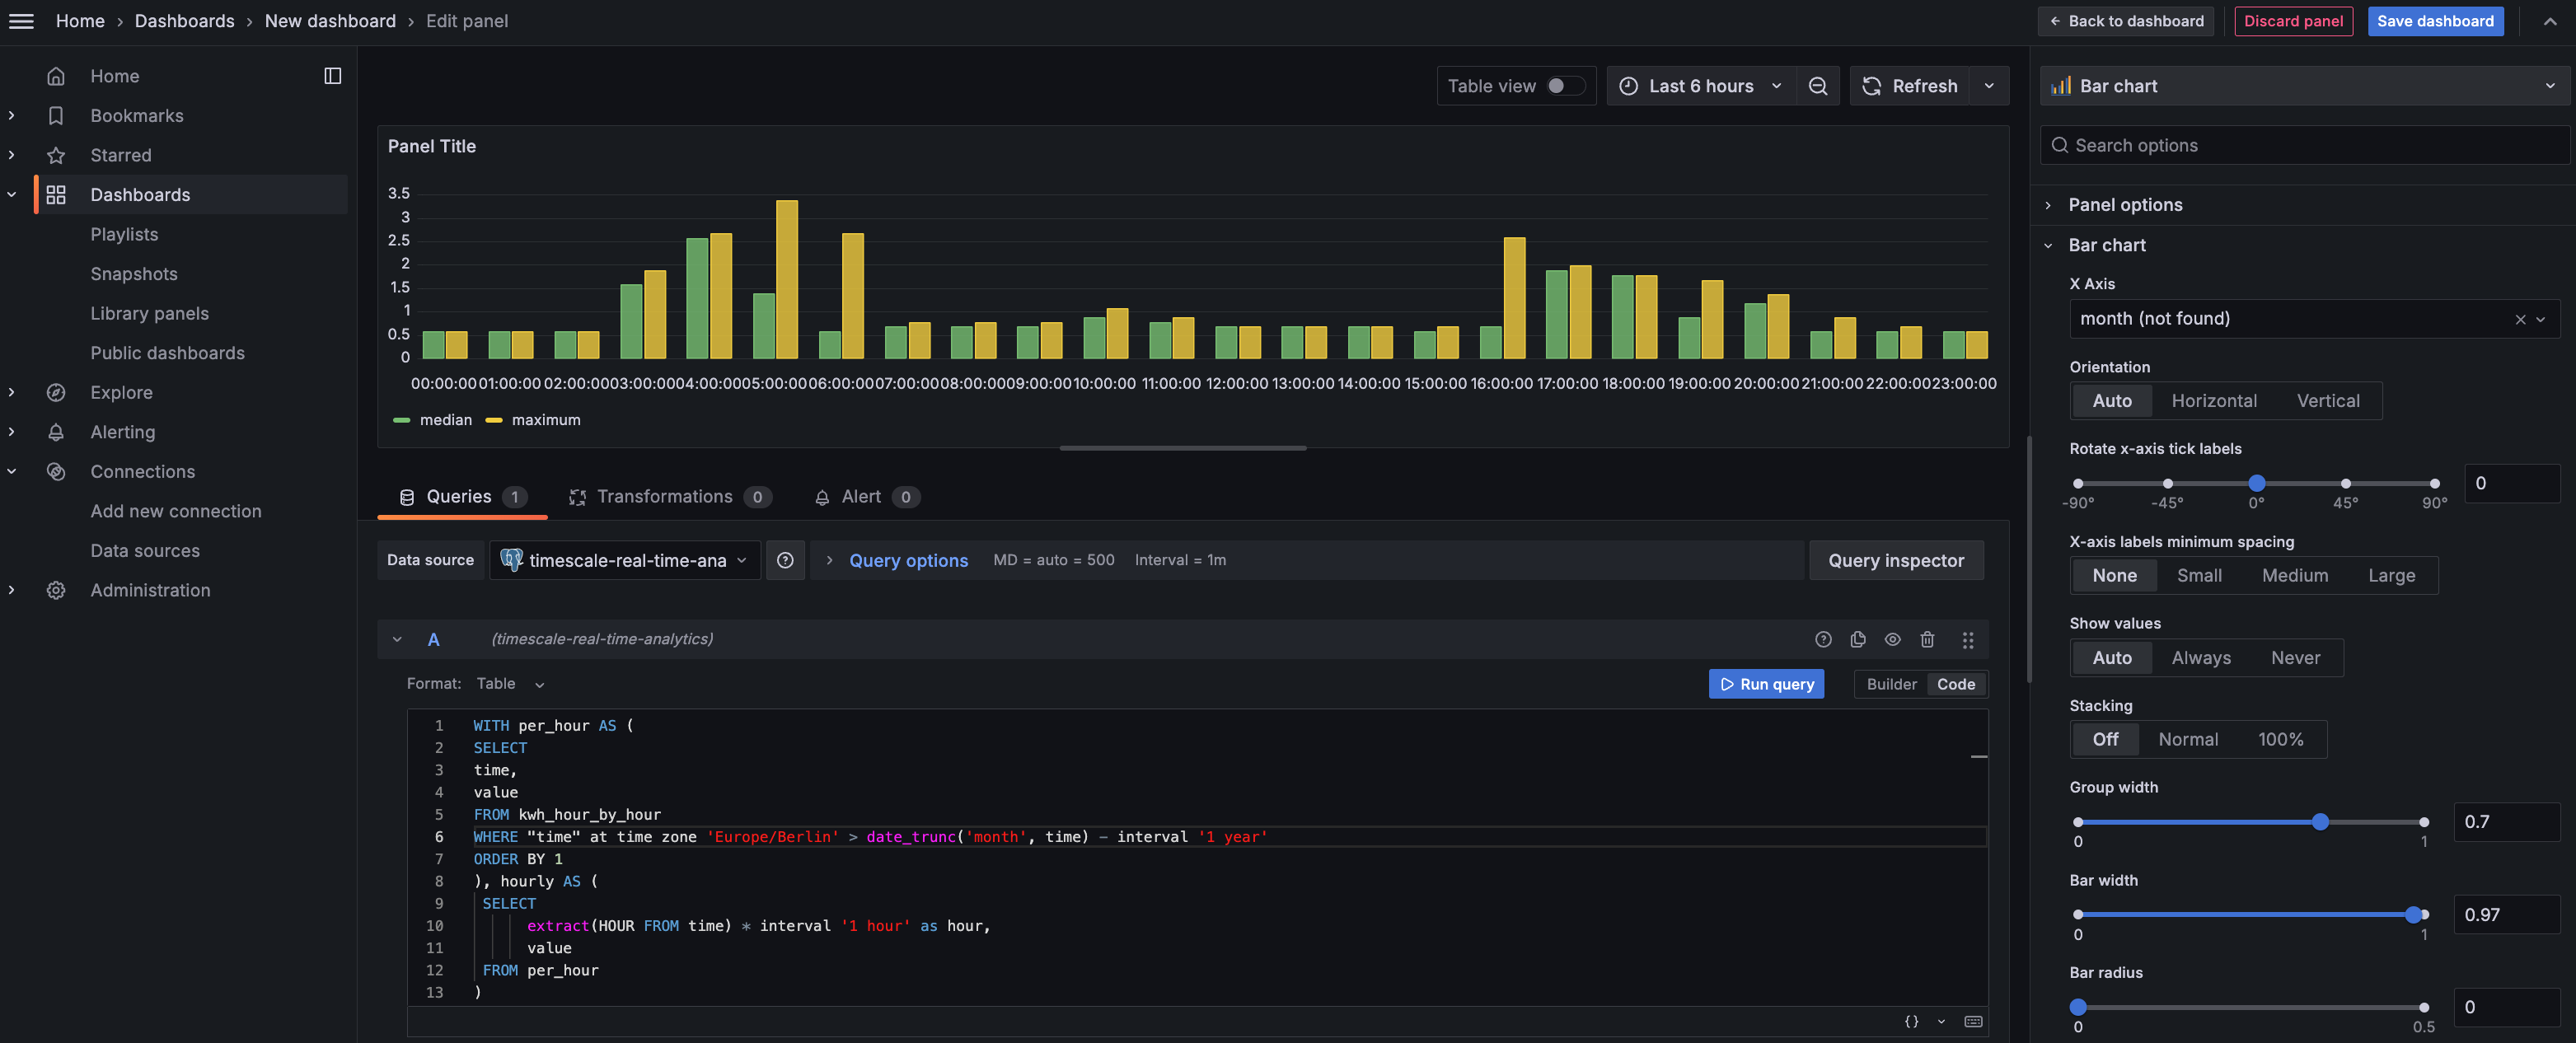
3. In the `Queries` section, select `Code`, then run the following query based on your continuous aggregate:
```sql
WITH per_hour AS (
SELECT
time,
value
FROM kwh_hour_by_hour
WHERE "time" at time zone 'Europe/Berlin' > date_trunc('month', time) - interval '1 year'
ORDER BY 1
), hourly AS (
SELECT
extract(HOUR FROM time) * interval '1 hour' as hour,
value
FROM per_hour
)
SELECT
hour,
approx_percentile(0.50, percentile_agg(value)) as median,
max(value) as maximum
FROM hourly
GROUP BY 1
ORDER BY 1;
```
This query averages the results for households in a specific time zone by hour and orders them by time.
Because you use a continuous aggregate, this data is always correct in real time.

You see that energy consumption is highest in the evening and at breakfast time. You also know that the wind
drops off in the evening. This data proves that you need to supply a supplementary power source for peak times,
or plan to store energy during the day for peak times.
2. **Click `Save dashboard`**
You have integrated Grafana with a {SERVICE_LONG} and made insights based on visualization of your data.
[grafana-docs]: https://grafana.com/docs/
[grafana-self-managed]: https://grafana.com/get/?tab=self-managed
[grafana-cloud]: https://grafana.com/get/
[use-time-buckets]: /use-timescale/:currentVersion:/time-buckets/use-time-buckets/
[test-drive-enable-compression]: /getting-started/:currentVersion:/try-key-features-timescale-products/#enhance-query-performance-for-analytics
[test-drive-tiered-storage]: /getting-started/:currentVersion:/try-key-features-timescale-products/#slash-storage-charges
[data-tiering]: /use-timescale/:currentVersion:/data-tiering/
[compression]: /use-timescale/:currentVersion:/compression/
[hierarchical-caggs]: /use-timescale/:currentVersion:/continuous-aggregates/hierarchical-continuous-aggregates/
[job]: /api/:currentVersion:/actions/add_job/
[alter_table_hypercore]: /api/:currentVersion:/hypercore/alter_table/
[compression_continuous-aggregate]: /api/:currentVersion:/hypercore/alter_materialized_view/
[informational-views]: /api/:currentVersion:/informational-views/jobs/
[add_columnstore_policy]: /api/:currentVersion:/hypercore/add_columnstore_policy/
[hypercore_workflow]: /api/:currentVersion:/hypercore/#hypercore-workflow
[alter_job]: /api/:currentVersion:/actions/alter_job/
[remove_columnstore_policy]: /api/:currentVersion:/hypercore/remove_columnstore_policy/
[in-console-editors]: /getting-started/:currentVersion:/run-queries-from-console/
[services-portal]: https://console.cloud.timescale.com/dashboard/services
[connect-using-psql]: /integrations/:currentVersion:/psql#connect-to-your-service
[insert]: /use-timescale/:currentVersion:/write-data/insert/
[hypercore]: /use-timescale/:currentVersion:/hypercore/